Decarbonization Report – Report Development, Assumptions, and Methods
OVERVIEW OF REPORT DEVELOPMENT
The Hawai‘i Pathways to Decarbonization Report (Decarb Report), published and submitted to the Hawai’i State Legislature in December 2023 analyzes the pathways and proposes recommendations to achieve the State’s economy-wide decarbonization goals. The report and the process of developing the report can be divided into four tiers.
Pathways and Engage Modeling
• Benchmarked models to the current GHG Inventory
• Worked with consulting firm E3 to analyze different PATHWAYS to achieve net-negative emissions incorporating all sectors of Hawaiʻi’s economy.
• Contracted with the National Renewable Energy Laboratory (NREL) to complete the electric sector modeling in Engage
Equity and Affordability Analysis
• Considered and highlighted impacts to environmental justice,
frontline, and low-income communities and make recommendations for how to mitigate any impacts to these communities and to facilitate a just transition to a decarbonized economy.
Outreach, Engagement, and Community Input
• Conducted sector-specific outreach in collaboration with the Hawaiʻi Climate Change Mitigation and Adaptation Commission
• Targeted outreach to existing working groups
• Individual outreach to private-sector contributors
• Facilitated outreach and engagement sessions with diverse stakeholder groups
Additional Analysis and Recommendations
• For measures that could not be modeled, researched gaps to inform recommendations
• Worked with University partners to evaluate sequestration options
• Considered emissions that are not accounted for in the current
statewide GHG inventory, inclusive of imported emissions as well as lifecycle emissions, which are of particular concern for biofuels, including sustainable aviation fuel
Click to Expand the Categories Below to Learn More
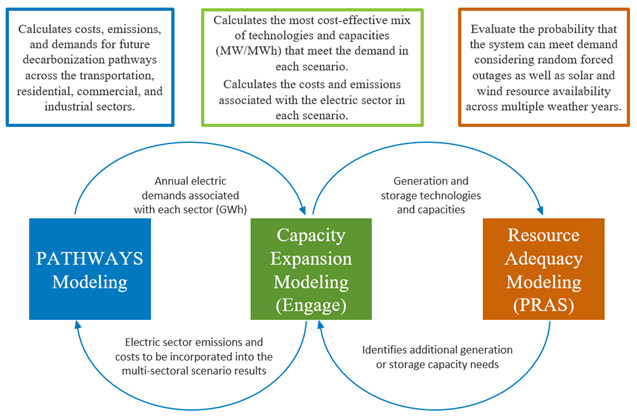
Inputs and assumptions applied to the electric sector capacity expansion model (Engage) as well as outputs of the Capacity Expansion Model.
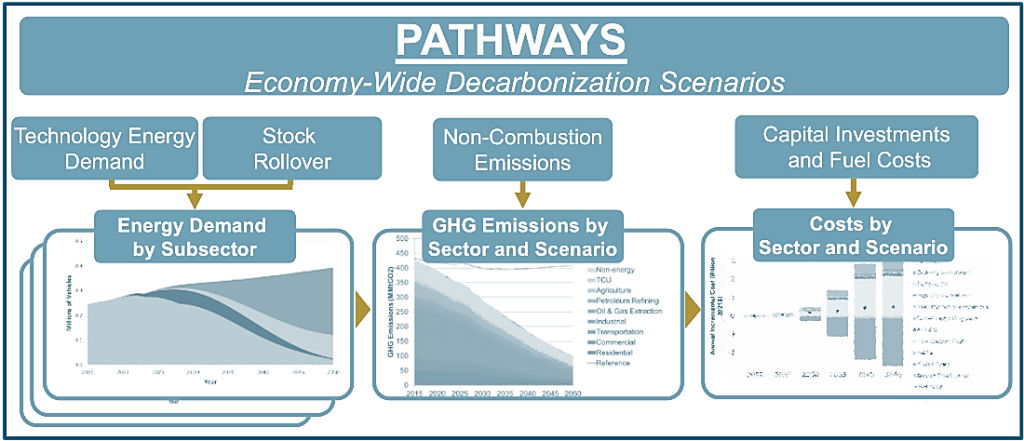
E3 created the PATHWAYS model to help policymakers, businesses, and other stakeholders analyze trajectories to achieving deep decarbonization of the economy. The model has been used in projects analyzing decarbonization at the utility service territory, state, and national level; recent examples include work with Hawaiian Electric, the California Energy Commission, the New York State Energy Research and Development Authority, and the Colorado Energy Office.
E3 used the PATHWAYS model to analyze decarbonization pathways for Hawaiʻi. The PATHWAYS model is an economywide representation of infrastructure, energy use, and emissions within a specified geography. The model allows comparison of user-defined scenarios of future energy demand and emissions to answer “what if” questions related to decarbonization. PATHWAYS can be used to explore the impacts and implications of potential climate and energy policies specified by the user, including energy, non-energy emissions, and technology costs. E3 built bottom-up island-level PATHWAYS models for Oʻahu, Hawaiʻi island, Kaua’i, Maui, Moloka‘i, and Lāna‘i, where each island was modeled individually.
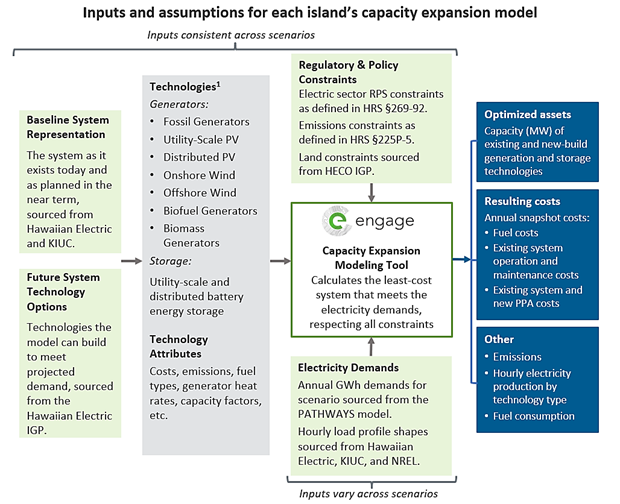
Engage™️ is a capacity expansion model co-designed by the Hawai‘i State Energy Office and NREL in 2017. Engage was developed to support the Energy Office in examining the trade-offs between different future energy system scenarios.
Capacity Expansion Modeling
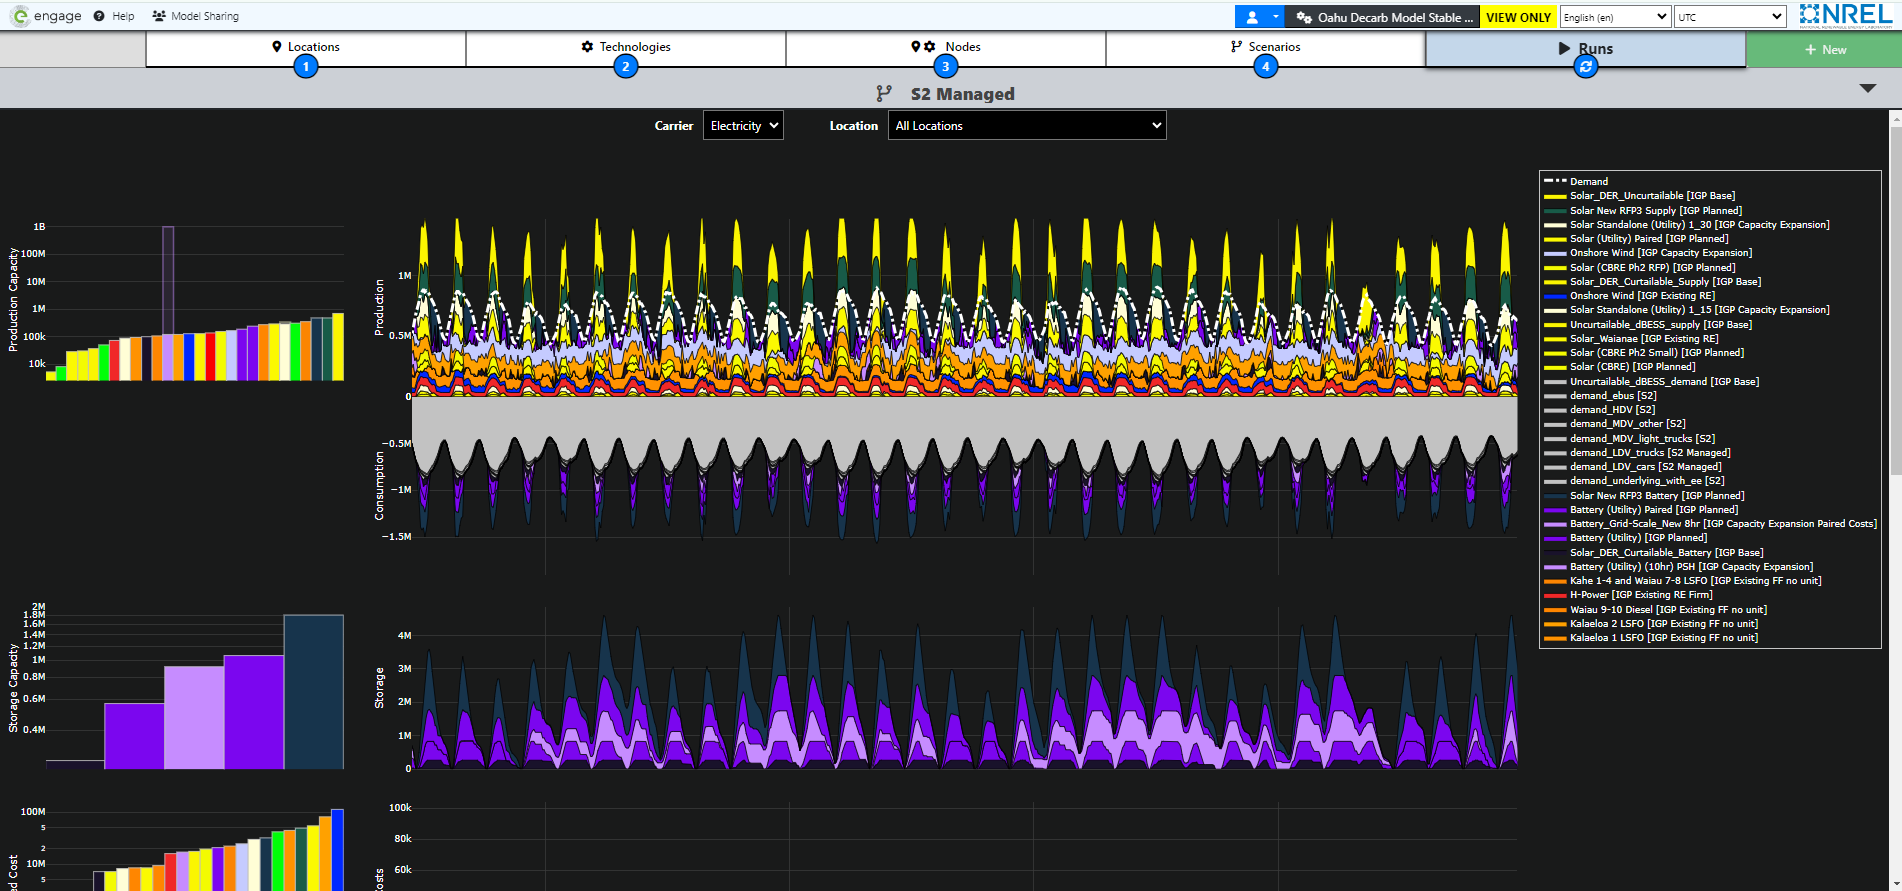
Determines the least-cost technology mix needed to meet demands, respecting all identified constraints. Engage is built around Calliope, a tested and well-documented open-source capacity expansion model allowing HSEO to utilize the model for future scenario runs.
Pictured left: Engage model interface, for illustrative purposes only.
HSEO contracted with E3 and NREL to complete the PATHWAYS and Engage analysis, respectively. PATHWAYS created the initial annual electric demands associated with each sector to ensure the models could be integrated. In turn, these demands were input into Engage to calculate the most cost-effective mix of technologies to meet the electric demands from the PATHWAYS model. Then these technologies were input into resource adequacy models to ensure the systems could meet demands on low-wind and solar days, in some cases additional generation and storage were added back into Engage. Finally, the Engage outputs were input back into PATHWAYS to incorporate electric sector emissions and costs back into the economy-wide models.
 EQUITY AND AFFORDABILITY
Equity means achieving the fair distribution of benefits and burdens regardless of social identity, and in a manner that respects and acknowledges each island’s cultural practices, historical experience, community values, and democratic participation (Energy Equity Hui).
In general, progress toward a more equitable economic system requires both the recognition and remediation of the unequal distribution of benefits and burdens based on access, social identities, and historical systems of economic and racial oppression (Energy Equity Hui).
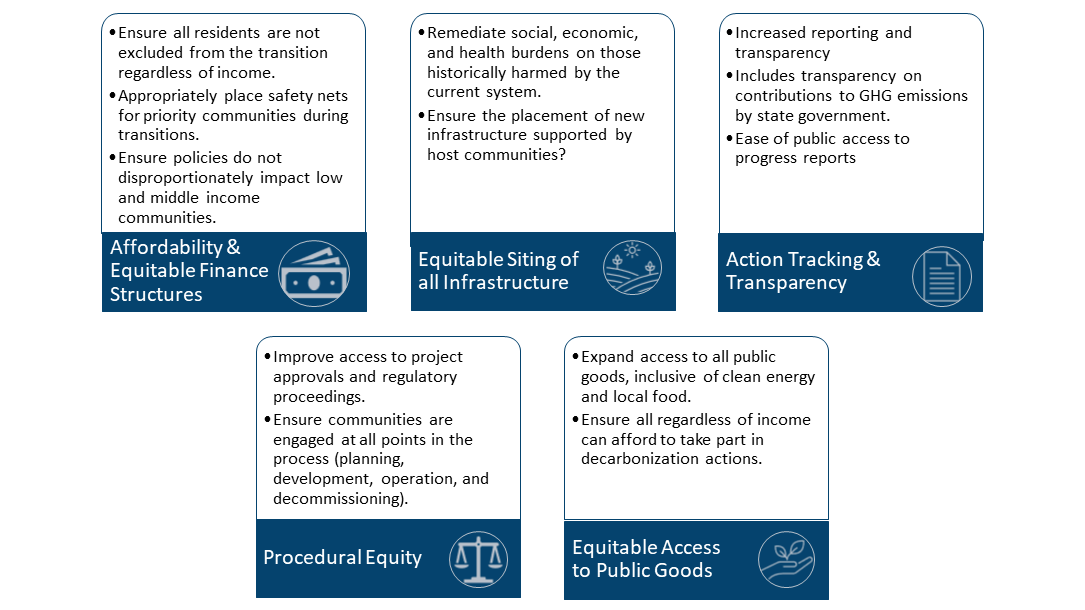
A key recommendation of the report was to widely apply the Equity Framework, developed by the Public Utilities Commission and Energy Equity Hui in the Energy Equity Docket. The Equity Framework is pictured below. The framework outlines five key pillars of equity including 1) Affordability and Equitable Finance Structures, 2) Equitable Siting of Infrastructure, 3) Action Tracking and Transparency, 4) Procedural Equity, and 5) Equitable Access to Public Goods.
Ongoing community engagement will be required to implement the measures discussed in this report successfully. Key themes and guiding principles were identified through outreach activities:
- Native Hawaiian values and ways of being center connection and responsibility to ancestors and descendants, to place, and to the peoples of a place. These values shall be a cornerstone of all paths forward.
- Communities have expressed their distaste for “check-the-box” engagement commonly associated with development actions, such as those requiring environmental review under HRS 343 – Environmental Impact Statements.
- Instead of check-the-box engagement after projects have been fully formulated, decarbonization projects and activities should all strive to ensure impacted communities have a voice at the table during all stages of development, from early planning through implementation and even after completion to integrate their priorities and elevate their concerns into policy, project development, and decision-making.
The Act 238 report relied on DOH emissions accounting to determine progress toward Hawai‘i’s net-negative GHG targets established by HRS §225P-5. The method currently used to count the statewide greenhouse gas inventory, published under HRS §342B-71 by DOH, focuses on the emissions based on production emissions within the state, called a production-based emissions inventory (PBEI), also known as a sector-based or territorial GHG inventory.
Production-based inventories are compiled using broadly accepted methods established by the EPA, IPCC, and other leading bodies. These methods always set a boundary that defines which emissions count, and which do not. In PBEI, the emissions associated with goods and services produced within a geographic boundary are counted, and emissions for products made elsewhere are not. Because PBEI methods do not count emissions associated with imports, this approach can unfairly penalize locally produced items and may favor outsourcing.
The quantitative analysis presented in the Decarbonization Report did not account for the full lifecycle emissions associated with many technologies and fuels necessary to decarbonize. For example, a broad assumption applied in the report was that energy derived from plant materials, specifically biomass and biofuels including sustainable aviation fuel, is carbon neutral. The report’s authors used this assumption to ease accounting, in addition, it is currently how emissions are accounted for in the Statewide GHG Inventory. However, as discussed in Chapter 5 of the report, this assumption is flawed and will require future analysis, improved accounting, and possible policy changes that encourage more transparency and granularity in reporting.
What is lifecycle analysis?
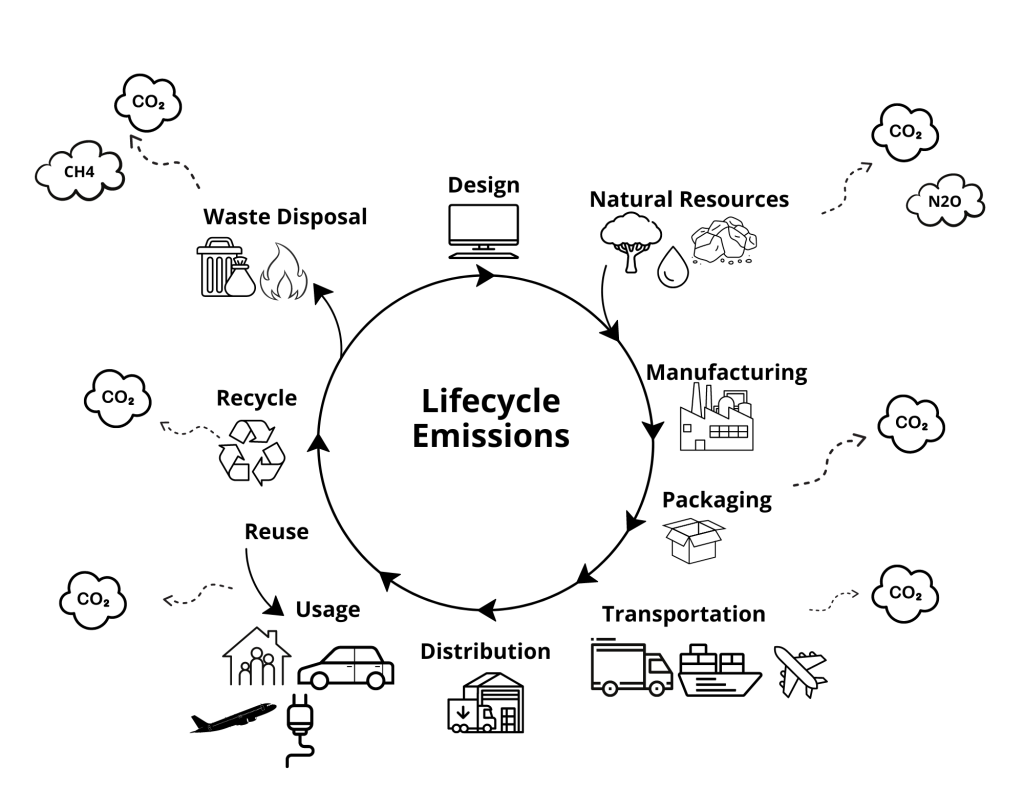
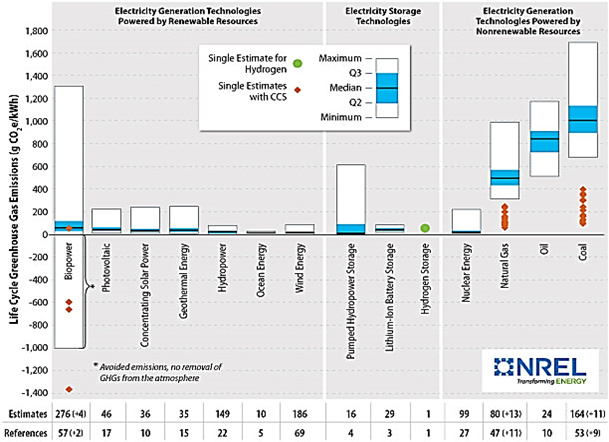
Lifecycle greenhouse gas analysis quantifies or evaluates the greenhouse gas emissions associated with the production and consumption of specific products or systems throughout their entire lifecycle – from extraction and assembly through distribution, use, to disposal. Lifecycle analysis focuses on the total emissions associated with the consumption of goods and services.
Why is lifecycle accounting critical for alternative fuels?
Fuels derived from non-fossil alternative sources including biofuels and hydrogen exhibit a diverse spectrum of lifecycle emissions.
It is critical to incorporate lifecycle analysis for these fuels because in some cases, the greenhouse gas emissions associated with their upstream emissions, inclusive of cultivation, may not be as clean as the fossil fuels they are replacing.
To standardize lifecycle emissions and allow for comparison between fuels, carbon intensity is utilized.
Carbon intensity refers to the amount of carbon dioxide (CO2) emissions produced per unit of a specific activity, output, or energy generated. It’s a measure used to quantify the environmental impact of various processes, activities, or sources by assessing how much greenhouse gas emissions they generate relative to their output. For example, in electricity generation, carbon intensity might be reported in CO2e per MWh, for transportation, carbon intensity might be reported in CO2e per passenger mile or CO2e per unit of distance traveled. The terms emission factor, carbon intensity, or emissions rate are often used interchangeably.
Image source: NREL Life Cycle Assessment Harmonization