
Decarbonization Report – Results and Key Findings
PATHWAYS & ENGAGE ANALYSIS RESULTS
HSEO has identified and prioritized near-, mid-, and long-term decarbonization opportunities. With a renewed focus on workforce development and community engagement, the commercialization of clean and efficient technologies can be the centerpiece of cost-effective decarbonization in Hawai‘i.
Modeling Results are broken down below, click to expand each section to learn more.
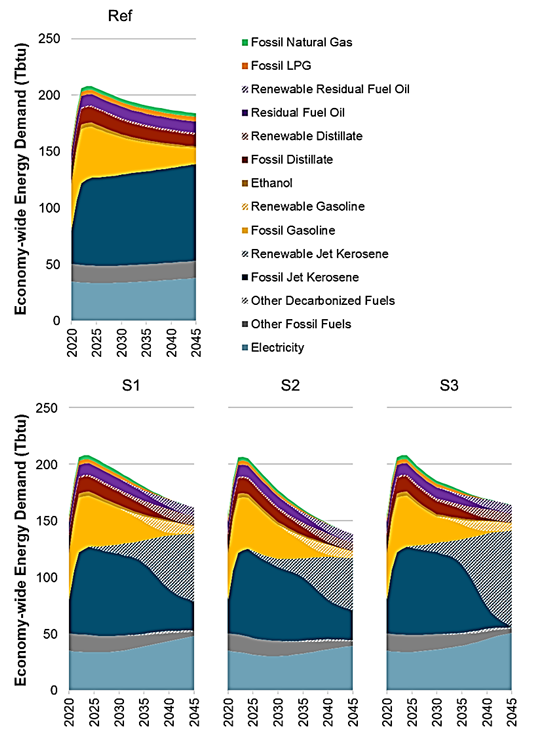
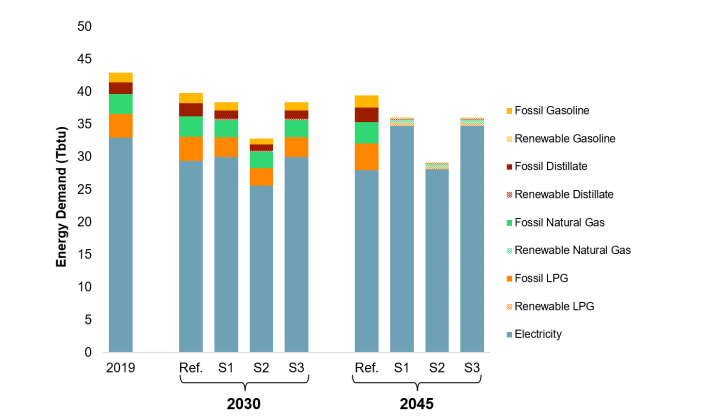
Economy-Wide Energy Demand by Fuel Type
Economywide energy demands across fuel types throughout the modeled time horizon, including electricity. All mitigation scenarios show growth of the total electric demand and growth in demand for alternative fuels.
Total energy demand declines in all mitigation scenarios.
Note that fuels consumed for electricity generation are not shown and are aggregated as “electricity”. The fuels for electricity production are shown in the electric sector section below.
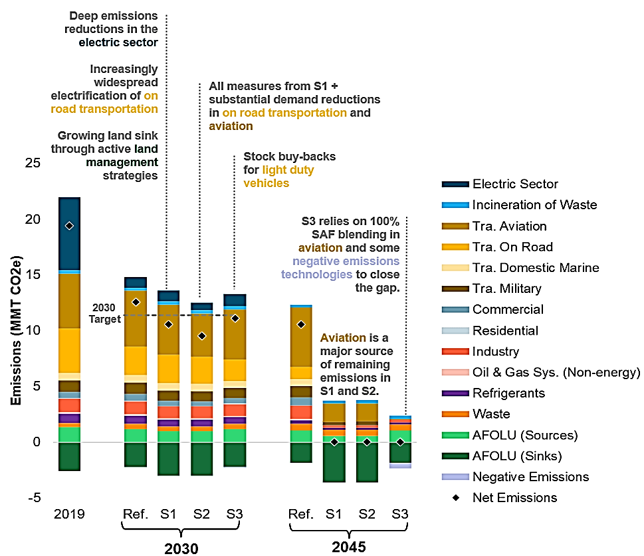
Emissions in Key Years by Sector
This stacked bar chart shows changes in GHG emissions by sector in each scenario in three key years: 2019, 2030, and 2045. The figure shows gross emissions as areas above the x-axis, negative emissions as areas below the x-axis, and net total emissions as a black diamond. In the Reference scenario, the bulk of emissions reductions come from RPS achievement leading to decarbonization of the electric power sector (shown in dark blue) and reductions in on-road transportation emissions due to electrification of light-duty vehicles (shown in yellow). The reference scenario does not meet the state’s net-negative target.
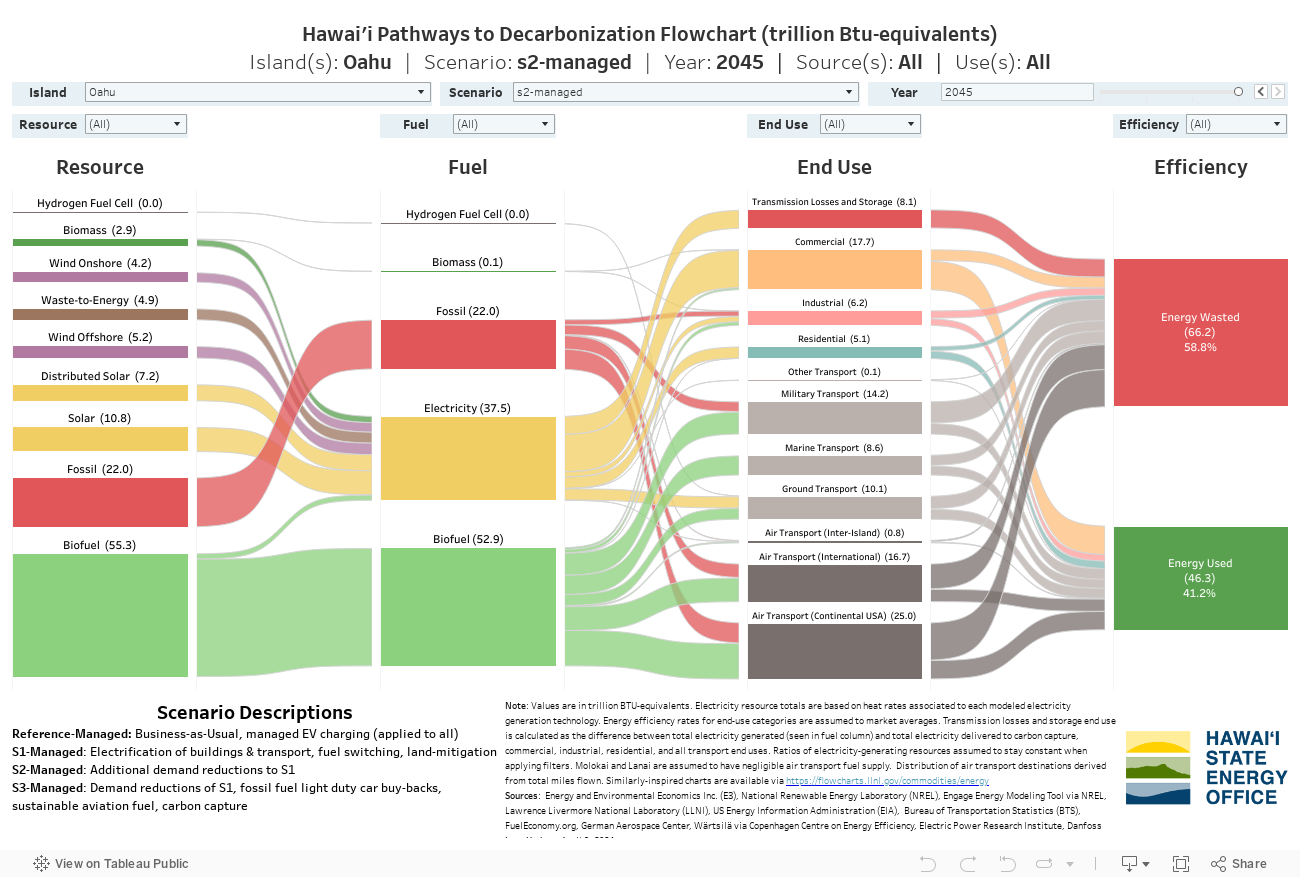
Economy-wide Energy Sources and Uses under the Decarbonization Scenarios
To analyze various decarbonization scenarios, capacity expansion modeling was completed with the National Renewable Energy Laboratory’s (NREL) Engage model for the electric sector. Each of the four scenarios constructed and tested meets Hawai‘i’s 2045 Renewable Portfolio Standard (RPS); however, each scenario addresses other sectors such as transportation differently.
To visualize Hawai‘i’s economy-wide energy consumption, the Sankey flowchart below enables users to visualize the statewide energy system or a single island’s under different decarbonization scenarios.
Electricity Demand
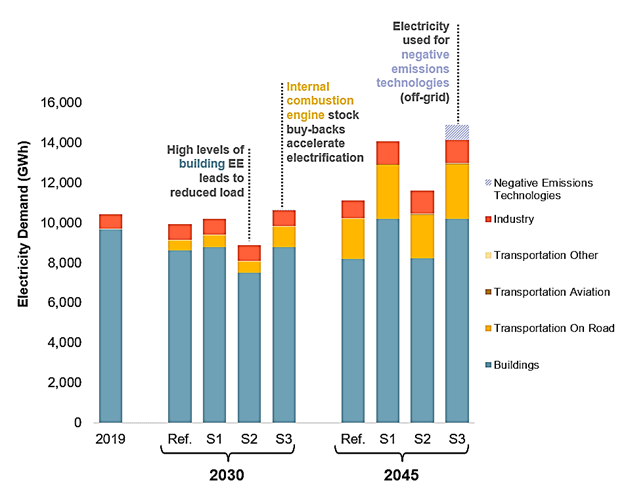
The figure shows the statewide electricity demands in the key snapshot years of 2019, 2030, and 2045. Future electricity demands are driven by the scenario assumptions across energy-consuming sectors. All scenarios show significant load growth in transportation largely due to the electrification of on-road vehicles. Note that while there is some electric aviation in the mitigation scenarios, the application was restricted to only a small subset of inter-island flights given the limitations of electric aviation with regards to the number of passengers that electric planes might be able to carry. Therefore, the electricity demands for aviation are very minor relative to other demands and are barely visible.
The three mitigation scenarios rely heavily on energy efficiency in buildings to reduce electricity demands. This is most pronounced in S2, which assumes the highest levels of energy efficiency. By 2030, total annual load shrinks relative to 2019 load in all scenarios except for S3 because of the high levels of energy efficiency assumed, a key assumption across all scenarios, this assumption defers from the analysis completed for Hawaiian Electric in a similar study. By 2045, however, all scenarios show load growth relative to 2019 loads.
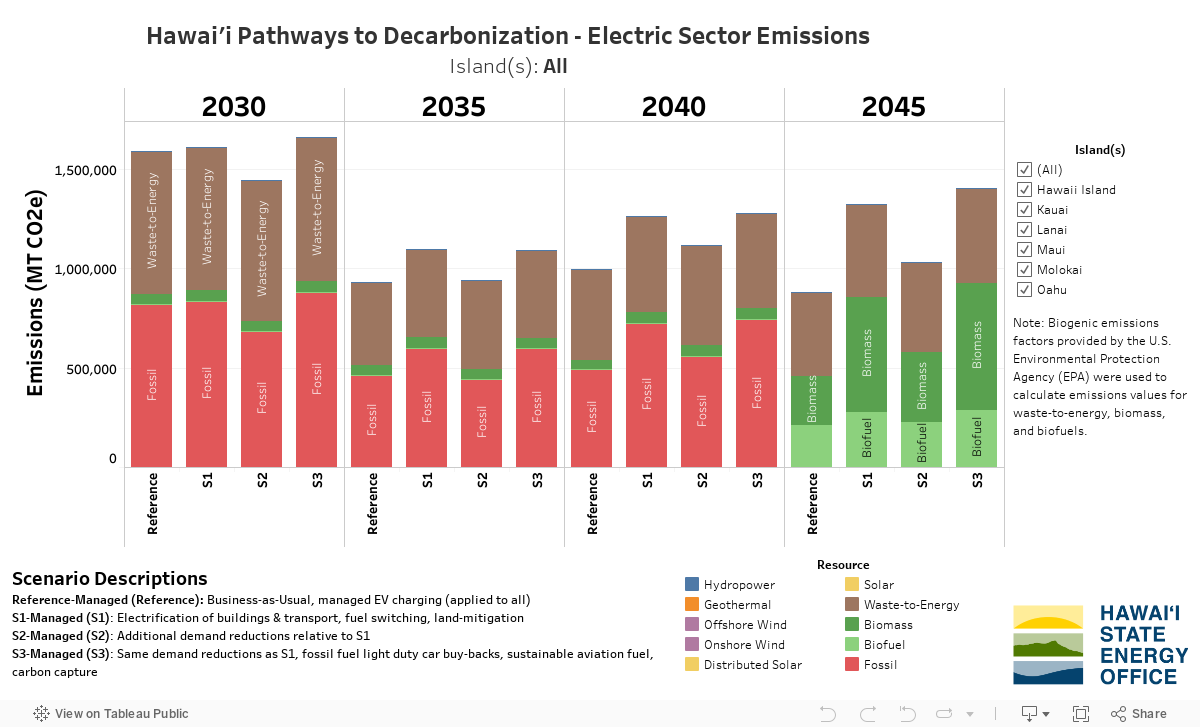
Electric Sector Emissions
As part of the report’s analyses, emissions values were tracked as NREL’s Engage capacity expansion model constructed optimal pathways to a 2045 electric sector free of fossil fuels. The dashboard below visualizes the emissions associated with each scenario’s electric generation technologies for each model year. By applying the filters located on the right-hand side of the dashboard, users can visualize statewide electric sector emissions or electric sector emissions by island.
Transportation Energy Demand
Transportation is inclusive of Aviation, Ground Transport, and Marine Transportation. The transportation sector, particularly the marine and aviation sub-sectors will require significant volumes of decarbonized fuels. The figure shows energy demand across fuel types for the transportation sector. Fossil fuels are shown with solid bars, while decarbonized fuels are shown in hashes. Given the challenges of electrification beyond light-duty vehicles, there is substantial demand for decarbonized fuels, with the aviation sub-sector exhibiting the most significant portion of demand.
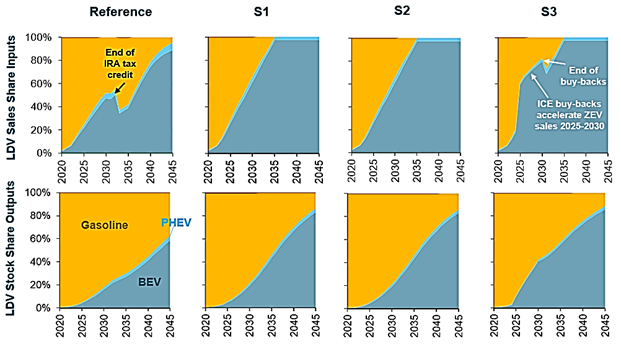
Ground Transportation Electrification – Light Duty Electric Vehicle Sales Driving Decarbonization
The Reference scenario assumes light-duty zero-emission vehicle (ZEV) sales aligned with a 2023 report by the International Council on Clean Transportation (ICCT). Sales are assumed to follow the moderate scenario for non-ACC II states, which includes impacts of the Inflation Reduction Act (IRA). Light-duty vehicles reach 46% of zero-emissions vehicle sales by 2035. Since the ICCT report only projected sales through 2035, an S-curve adoption trajectory was applied to extend the sales projections through 2045. Light-duty vehicles reach 95% of zero-emission vehicle sales by 2045. Currently, Hawaiʻi has 2.6% of battery electric vehicle stock as of October 2023, relative to ICCT’s forecasted 1.6%, showing that Hawaiʻi is currently ahead of the ICCT forecasts.
All three mitigation scenarios assume Hawaiʻi will have 100% zero-emission light-duty vehicle sales by 2035. Long vehicle lifetimes limit the pace of the stock transition for on-road vehicles given that vehicles are typically replaced at the end of useful life.
Despite all three mitigation scenarios achieving 100% zero-emission vehicle sales shares by 2035, S1 and S2 only achieve 21% light-duty vehicle ZEV stock shares by 2030.
S3 assumes that a fraction of (ICE) light-duty vehicles are retired early through a stock buy-back program from 2025 to 2035. This leads to an accelerated transition of light-duty vehicle stocks compared to S1 and S2 (S3 achieves a 42% ZEV stock share by 2030). This suggests that stock buybacks would be necessary to dramatically increase the 2030 ZEV stock share. There are remaining internal combustion engine vehicles on the road through 2045 because of the long lifetimes of the vehicles. It is assumed the remaining fuel demand for internal combustion engine vehicles will be met with 100% renewable gasoline and renewable diesel by 2045.

Vehicle Miles Travelled (VMT) – Reducing Travel Demand, Reduces Energy Needed for Transportation Sector
A 2019 study by The State Smart Transportation Initiative (SSTI) and Smart Growth America, along with Rhodium Group, outlines methods to estimate future VMT under a policy scenario aimed at achieving Hawai‘i’s 100% clean energy goal by 2045. The study’s mitigation scenario shifts household growth to higher-density areas and includes policy actions such as:
- Increased land use mixing and street connectivity in Honolulu and Maui.
- Higher parking costs: doubling in Downtown Honolulu, 25% increase elsewhere in Honolulu, Hawai‘i, and Kaua‘i counties, and 10% increase in Maui.
- Improved transit access: 10% in Honolulu and Maui, 40% in Hawai‘i and Kaua‘i.
- Road pricing measures that increase the cost of driving by 50% statewide.
The study estimates a 20% reduction in total statewide VMT by 2045 due to these measures, with road pricing and parking cost increases being the largest contributors. Land use and transit improvements also significantly reduce VMT by promoting development within existing transportation corridors and reducing reliance on personal vehicles.
To avoid regressive impacts, it is crucial to implement infrastructure improvements enabling alternative transportation before increasing driving costs. Revenue from these measures should fund the necessary VMT reduction infrastructure.
As shown in the first figure (slide 1), adopting VMT measures can reduce the total energy demand.
Building Energy Demand
Electricity serves most of the demand in Hawai’i’s buildings today. In the mitigation scenarios, electricity makes up almost the entirety of energy demand in buildings due to electrification across all major end-uses (e.g. water heating and cooking). Energy efficiency plays a major role in all scenarios to curb load growth in buildings despite additional electrification. By 2045, the remaining fuel demands in buildings are assumed to be met with decarbonized fuels.
All scenarios include energy efficiency (EE) improvements based on the Hawaiʻi PUC’s market potential study. The Reference scenario assumes energy efficiency in line with the “Achievable Potential – BAU” scenario. S1 and S3 assume energy efficiency in line with the “Achievable Potential – High” scenario. S2 assumes even greater levels of energy efficiency in buildings, using the “Economic Potential” scenario.
Energy efficiency is employed across all residential and commercial end-uses, including air conditioning, water heating, lighting, cooking, and refrigeration, amongst others.
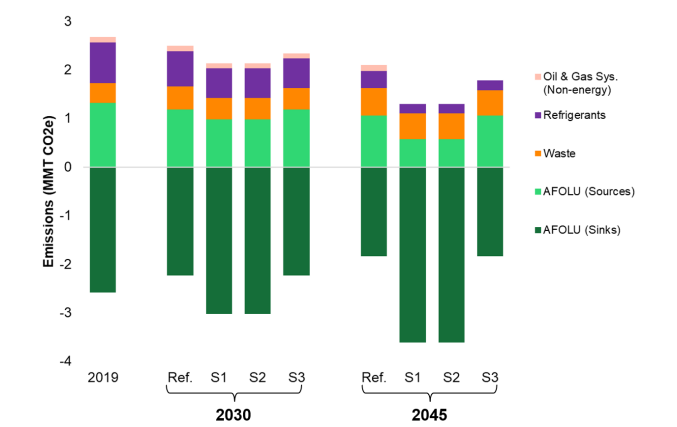
Refrigerants, Waste, AFOLU Sources, and AFOLU Sinks
The figure shows the emissions from non-combustion sources, including non-energy emissions from the oil and gas system, refrigerants, waste, agriculture, forestry, and other land uses. Non-energy emissions from the oil and gas system decline to zero by 2045 with the phaseout of fossil fuel production. Assumptions for refrigerant and waste mitigation were the same across the three mitigation scenarios.
There are two distinctly different trajectories for agriculture, forestry, and other land uses (AFOLU) shown in green.
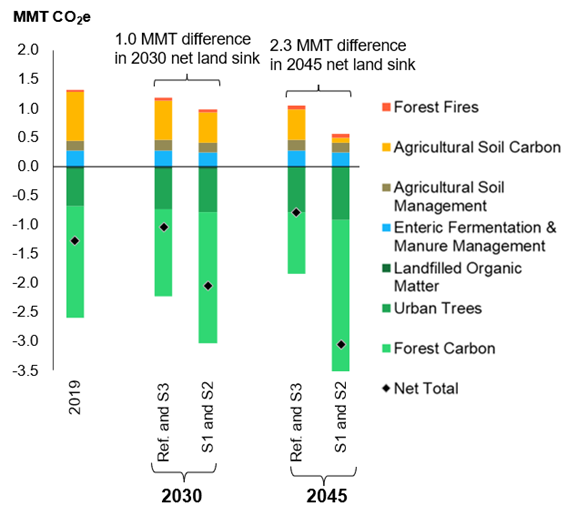
Agricultural, Forestry, Other Land Uses – A Source and Sink
There are two distinct trajectories for sources and sinks within agriculture, forestry, and other land uses (AFOLU). S3 follows the same trajectory as the Reference scenario, which assumes that the net land sink shrinks over time relative to 2045. This reference trajectory is based on a 2017 Hawaiʻi-specific report by the US Geological Survey that projects future carbon fluxes.[1]
S1 and S2 assume a greater level of effort towards mitigation in AFOLU, and therefore a growing net land sink through 2045 relative to 2019. Potential mitigation measures were identified based on a 2020 report by Conservation International: Reversing Climate Change: A study of pathways through Hawaiʻi’s natural & working lands.[2] These include wide-ranging measures focused on sustainable agricultural practices, protection of natural lands, and restoration. The Conservation International report estimated a maximum technical potential from each mitigation measure but did not account for competing land uses or other feasibility constraints when calculating abatement potential. Therefore, the growth rate from the “High Sequestration” case from White House 2021 Biennial Report was used to provide an appropriate upper bound on the total change in the net land sink by midcentury, and trajectory was found to be well within the range of the non-overlapping technical potential from the Conservation International report.[3]
Results highlight the importance of active land management, regenerative agriculture, and forest conservation.
[1] Giardina, C. P. (2017). United States Geological Survey, Professional Paper 1834 Baseline and projected future carbon storage and carbon fluxes in ecosystems of Hawai‘i.
[2] Conservation International for the State of Hawai‘i Office of Planning on behalf of the Greenhouse gas sequestration task force (2020). Reversing Climate Change: A study of pathways through Hawai‘i’s natural and working lands.
[3] US 7th National Communication. (2021) White House.gov A review of sustained climate action through 2020
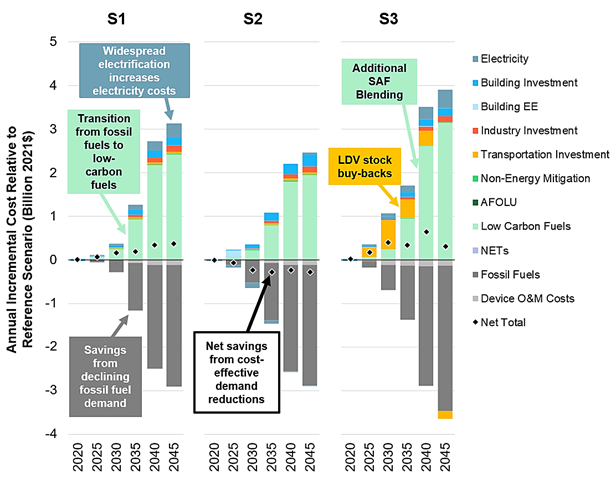
Annual Direct Costs
The figure shows the annual incremental costs of each scenario relative to the Reference scenario. The colors represent the different modeled costs by sectors. Bars above the x-axis are positive while those below are negative. The negative costs represent savings relative to the Reference scenario. The diamonds represent the net total cost for each year, which is the sum of all positive and negative cost categories.
In all three scenarios, the largest cost savings come from reduced fossil fuel consumption, as seen in the gray bars. On the positive side of the axis, there are large costs associated with the demand for low-carbon fuels, which can be seen in the light green cost bars. The bulk of the low carbon fuel demand is for sustainable aviation fuel, which is one of the main drivers of cost. The size of the fuel cost bars relative to the other costs highlights the key role that decarbonized fuel is playing across the board in these scenarios.
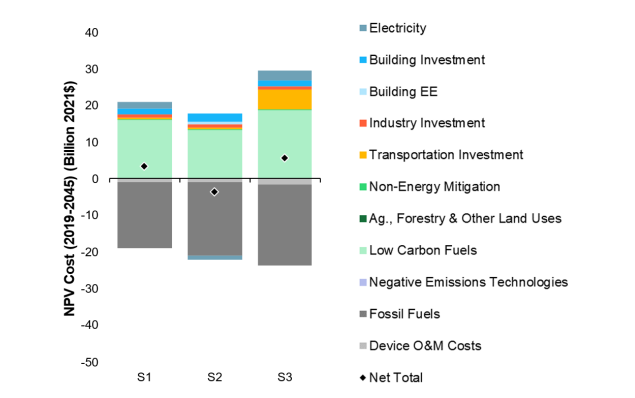
Net Present Value Direct Scenario Costs
The figure shows the net present value (NPV) of incremental costs relative to the Reference scenario from 2019-2045. This is a different way to look at the costs of each scenario, representing the total scenario cost over the modeled time horizon, 2019 through 2045. NPV costs were calculated using a 2% discount rate.
- S1 has a total NPV cost of $3.4B
- S2 has a savings of $3.4B
- S3 has a total NPV cost of $5.8B.
Notably, S2 has net savings relative to the Reference scenario, despite its accelerated emissions reductions relative to S1 and S3. This is due to the demand reductions, which simultaneously reduce emissions and costs because of the decreased demand for electricity and fuels. S3 is the most expensive scenario because of the additional gap-closing measures applied, including stock buybacks, additional sustainable aviation fuel, and negative emissions technologies.
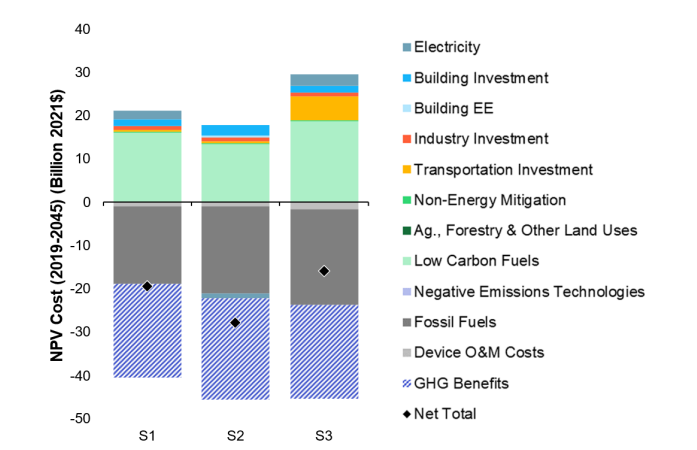
Incorporating Climate Benefits into Cost Analysis
The previous section only includes direct costs in the cost analysis to implement the described measures. However, when the societal benefits from avoided greenhouse gases are considered in addition to direct costs, all three scenarios show large net benefits. The figure shows the added benefits of avoiding greenhouse gases using the EPA Draft “Report on the Social Cost of Greenhouse Gases”. These benefits are shown in the purple hashed bar.
The social cost of greenhouse gases represents the marginal benefits of greenhouse gas abatement to society at large. The EPA Draft Report used in this study values CO2 at $287/ton in 2045 with a 2% discounting rate. These benefits are not specific to Hawaiʻi, but they include impacts on things like net agricultural productivity, damage from increased flood risk, and changes to the frequency and severity of natural disasters. Once the societal benefits are considered, the benefits of decarbonization far outweigh the costs, with net benefits ranging from $16-28.
Source: HAWAI‘I PATHWAYS TO DECARBONIZATION – ACT 238, SESSION LAWS OF HAWAI‘I 2022 “Chapter 4. Scenario Analysis Results“