Decarbonization
OVERVIEW
Under Hawai’i Revised Statutes §225P-5, Hawai’i has a target “to sequester more atmospheric carbon and greenhouse gases than emitted within the State as quickly as practicable, but no later than 2045”, effectively establishing a net-negative emissions target.
Hawaiʻi seeks to lead by example in adapting to the impacts and mitigating the extent of climate change. Hawai’i was the first state in the nation to declare a climate emergency. Through Senate Concurrent Resolution 44 SD1 HD1, Hawai’i recognized the global climate crisis endangers the health, safety, and welfare of the people, warranting preemptive and protective action. The resolution further requested statewide entities to pursue climate mitigation and adaption efforts and established “a statewide commitment to a just transition toward a decarbonized economy…”
INTERGENERATIONAL EQUITY
The concept of intergenerational equity specifies that each generation has the right to inherit the same diversity and cultural resources enjoyed by previous generations and to have equitable access to the use and benefits of these resources.
The Hawai’i Constitution states:
“For the benefit of present and future generations, the State and its political subdivisions shall conserve and protect Hawaii’s natural beauty and all natural resources, including land, water, air, minerals and energy sources, and shall promote the development and utilization of these resources in a manner consistent with their conservation and in furtherance of the self-sufficiency of the State. All public natural resources are held in trust by the State for the benefit of the people.”
Article XI, Hawai’i Constitution

The data presented above are rounded to the nearest tenth and are for demonstration purposes. Data were obtained from the United States Environmental Protection Agency (EPA) Greenhouse Gas Inventory to show annual measurements since 1990. The State of Hawai'i Greenhouse Gas Inventory, published annually, will ultimately determine state emissions. Data published by the EPA closely coincide with the data in the state inventory published by the Department of Health. EPA data is used above to show emissions through time. State data should be used for sector-specific information - EPA data is appropriate to show trends through time.
EVALUATING Decarbonization
In 2022, the State Legislature passed Act 238 which tasked the Hawai‘i State Energy Office to "analyze pathways and develop recommendations for achieving the State's economy-wide decarbonization goals.” The report evaluated emission reduction pathways from all emitting sectors economy-wide. The report also addressed the following Act 238 requirements.
- Recommend regulatory or other state action; that will ensure the attainment of the State's decarbonization goals;
- Include measures to reduce emissions from electricity, including accelerating the adoption of clean energy and improving energy efficiency for residential, commercial, and government users;
- Include land use and transportation planning measures aimed at reducing emissions from the transportation sector;
- Recommend state actions to address emissions associated with air travel and shipping, including how to encourage electrification and adoption of alternative fuels;
- Recommend best management practices in the agricultural sector;
- Include long—term carbon sequestration and carbon capture and utilization opportunities;
- Make recommendations to aid in the transition of the state workforce to meet the needs of a decarbonized economy;
- Consider impacts to environmental justice, frontline, and low-income communities and make recommendations for how to mitigate any impacts to these communities and to facilitate a just transition to a decarbonized economy;
- Determine the most cost-effective pathway to decarbonization;
- Rank recommendations based on level of impact, cost, and ease of implementation;
- Make recommendations on whether the goals established pursuant to section 225P—5, Hawaii Revised Statutes, should be adjusted, or if additional interim goals between the completion of the analysis and 2045 should be adopted
- Examine contributions of different carbon sources, how each source can be reduced, what entities are responsible for the reduction of each source, and how each source factors into the determination of statewide greenhouse gas reduction goals; and
- Include other relevant considerations as deemed appropriate and necessary.
Act 238 Session Laws of Hawai'i 2022
DECARBONIZATION AND CLIMATE
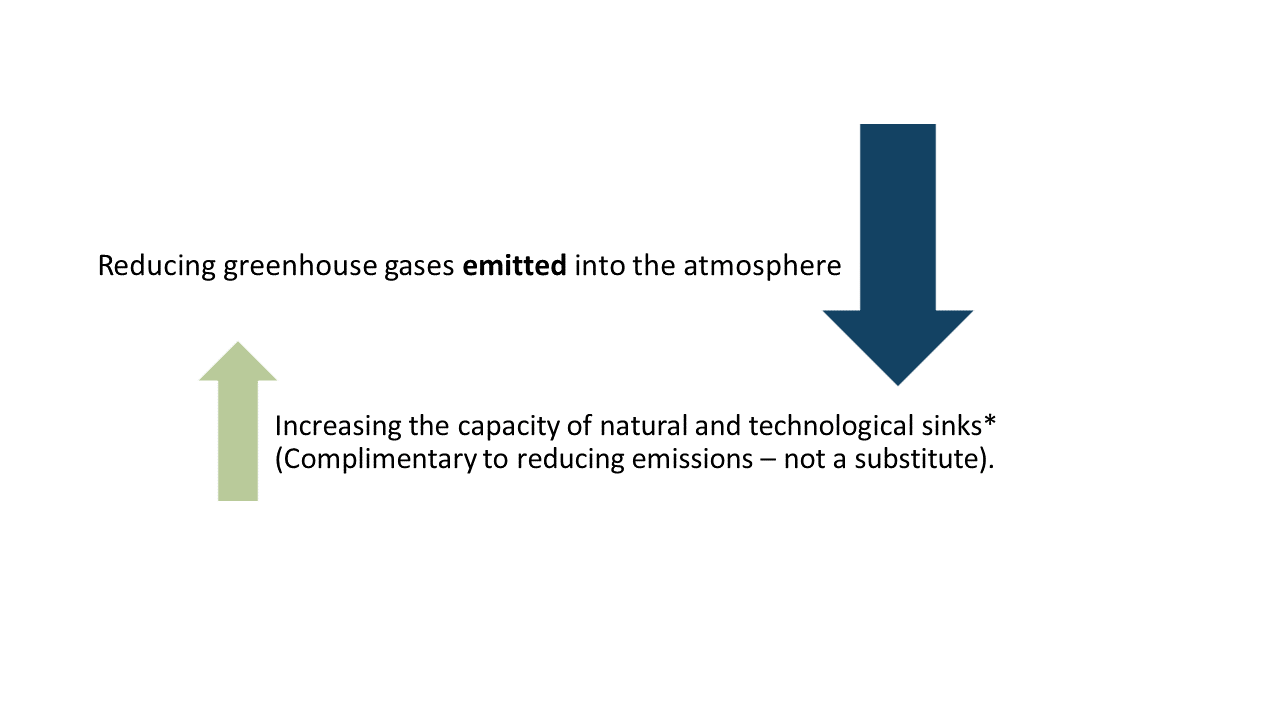
WHAT IS DECARBONIZATION?
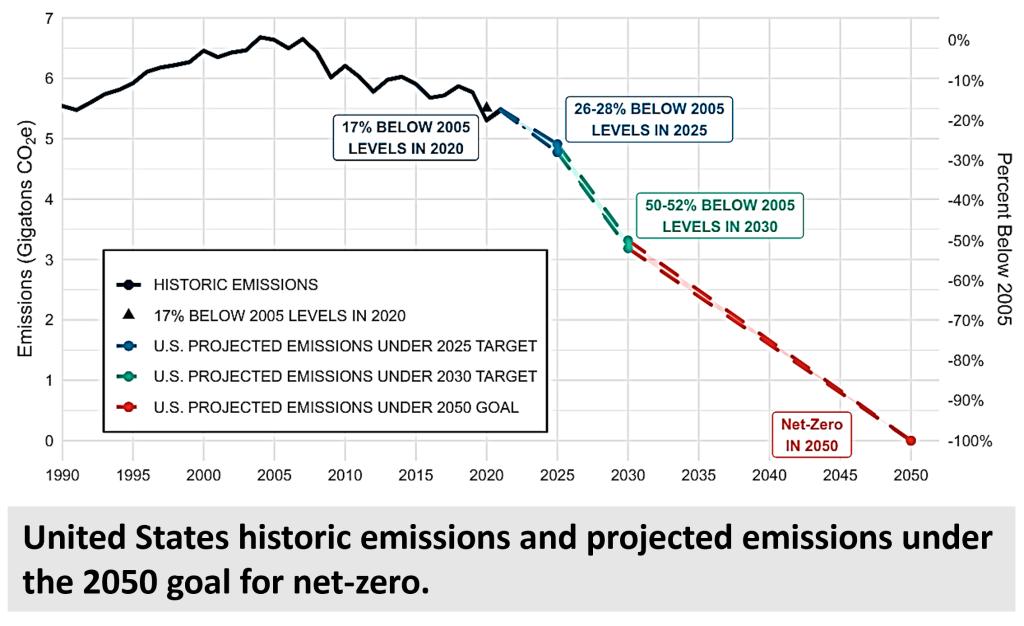
Hawai'i Emission Targets Align with the Paris Agreement
- Hawai‘i’s GHG Emission Targets are consistent with the Nationally Determined Contributions (NDCs)
- NDCs are at the heart of the Paris Agreement; embody efforts by each country to reduce national emissions.
- NDCs represent collective action - all state and local parties must do their part, no matter their size.
- NDCs are Intended to limit climate warming to 1.5 °C.
For NDCs to work, they need to be widely understood and used by businesses, civil society [including states], academia, and ordinary citizens” ~ United Nations Framework Convention on Climate Change.
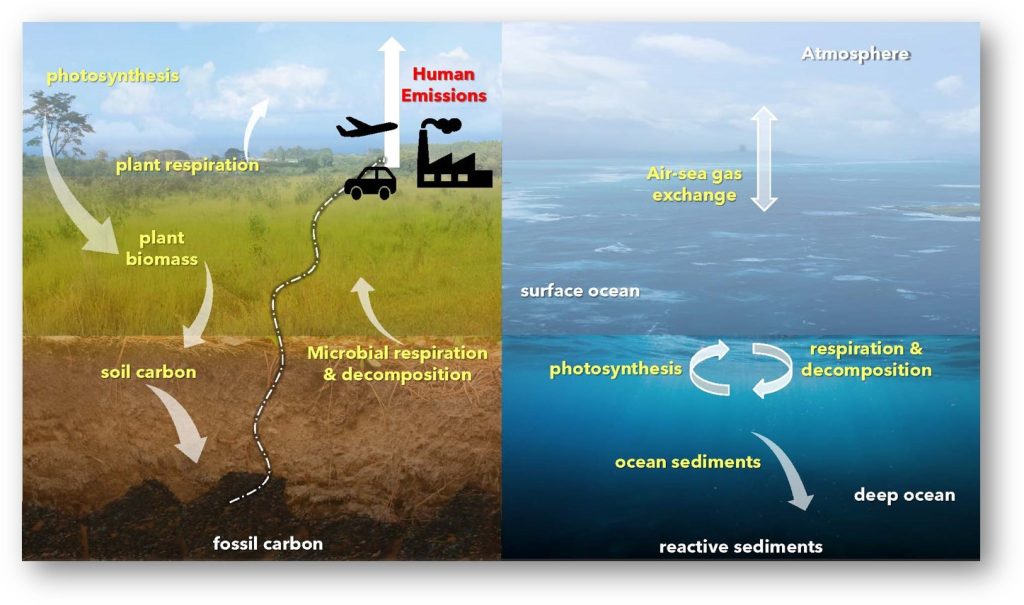
The Carbon Cycle
Understanding the carbon cycle is fundamental to understanding the impacts of continued fossil fuel usage.
Arrows show the movement of carbon between the land, atmosphere, and oceans. Yellow text indicates natural fluxes or active carbon, white text indicates stored carbon, and red text indicates human emissions.
Adapted from NASA Earth Observatory
Coal is compressed dead plant matter that has not decayed, but instead accumulated over millions of years.
Petroleum (crude oil) and natural gas are made of plankton that has not decayed and has accumulated on ancient sea floors eventually getting buried deeper by sediment and mud. The increased pressure as well as heat gradually turned the sediment into a rock and the dead plankton into oil and gas.
When fossil fuels such as coal and oil are burned all the carbon these organisms have captured and accumulated over millions of years is released. Thus millions of years’ worth of sequestered/stored carbon have been released over a period of several decades (since the industrial revolution).
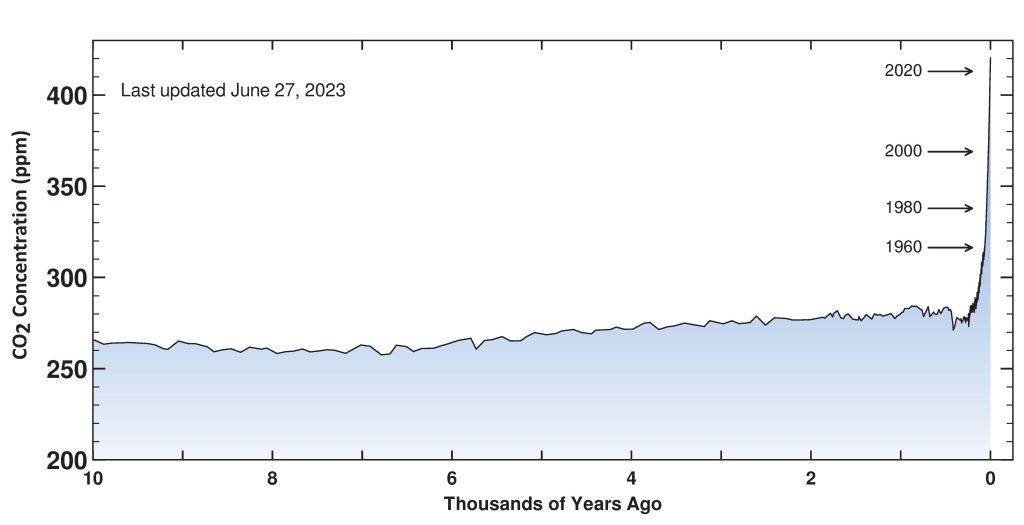
The Keeling Curve shows measurements of atmospheric CO2 through time. Measurements at Mauna Loa began in 1958. Pre-dating regular in-situ measurements, data from polar ice core air bubbles provide information on past atmospheric CO2 concentrations. In 2013, CO2 levels surpassed 400 ppm for the first time in over 400,000 years.
Source: Scripps Institution of Oceanography at UC San Diego
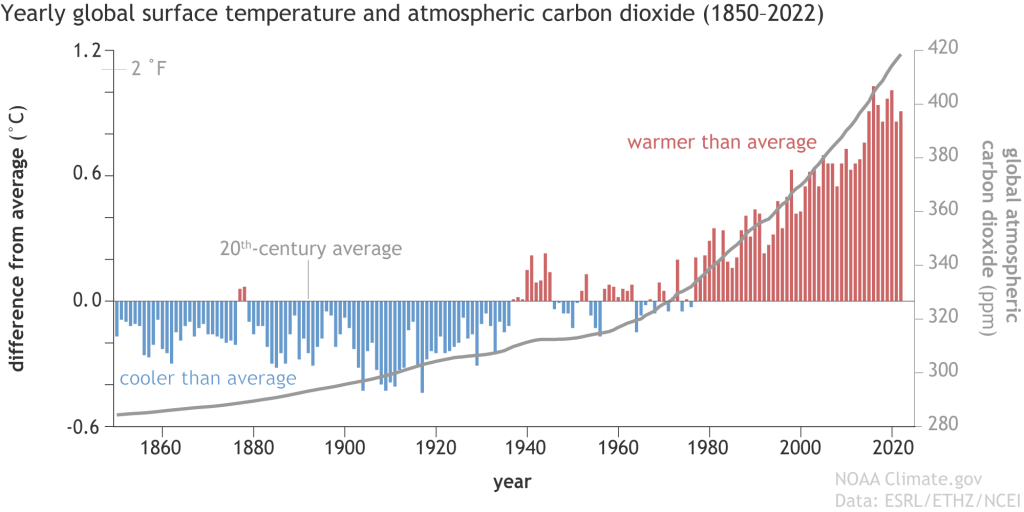
Since the industrial revolution, temperature changes track closely with atmospheric carbon dioxide concentrations. The graph shows yearly temperature compared to the twentieth-century average (red bars show mean temperature warmer than average, blue bars show mean temperature colder than average) from 1850–2022 and atmospheric carbon dioxide amounts (gray line): 1850-1958 from IAC, 1959-2019 from NOAA ESRL—original graph by Dr. Howard Diamond (NOAA ARL), and adapted by NOAA Climate.gov.
![Figure 27.2: Monitoring regional indicator variables in the atmosphere, land, and ocean allows for tracking climate variability and change. (top) Observed changes in key climate indicators such as carbon dioxide concentration, sea surface temperatures, and species distributions in Hawai‘i and the U.S.-Affiliated Pacific Islands result in (bottom) impacts to multiple sectors and communities, including built infrastructure, natural ecosystems, and human health. Connecting changes in climate indicators to how impacts are experienced is crucial in understanding and adapting to risks across different sectors. Source: Keener, V., D. Helweg, S. Asam, S. Balwani, M. Burkett, C. Fletcher, T. Giambelluca, Z. Grecni, M. Nobrega-Olivera, J. Polovina, and G. Tribble, 2018: Hawai‘i and U.S.-Affiliated Pacific Islands. In Impacts, Risks, and Adaptation in the United States: Fourth National Climate Assessment, Volume II [Reidmiller, D.R., C.W. Avery, D.R. Easterling, K.E. Kunkel, K.L.M. Lewis, T.K. Maycock, and B.C. Stewart (eds.)]. U.S. Global Change Research Program, Washington, DC, USA, pp. 1242–1308. doi: 10.7930/NCA4.2018.CH27](https://energy.hawaii.gov/wp-content/uploads/2022/10/figure27_2-1020x1024.png)
Source: Keener, V., D. Helweg, S. Asam, S. Balwani, M. Burkett, C. Fletcher, T. Giambelluca, Z. Grecni, M. Nobrega-Olivera, J. Polovina, and G. Tribble, 2018: Hawai‘i and U.S.-Affiliated Pacific Islands. In Impacts, Risks, and Adaptation in the United States: Fourth National Climate Assessment, Volume II [Reidmiller, D.R., C.W. Avery, D.R. Easterling, K.E. Kunkel, K.L.M. Lewis, T.K. Maycock, and B.C. Stewart (eds.)]. U.S. Global Change Research Program, Washington, DC, USA, pp. 1242–1308. doi: Impacts, Risks, and Adaptation in the United States: Fourth National Climate Assessment, Volume II
EMISSIONS OVERVIEW
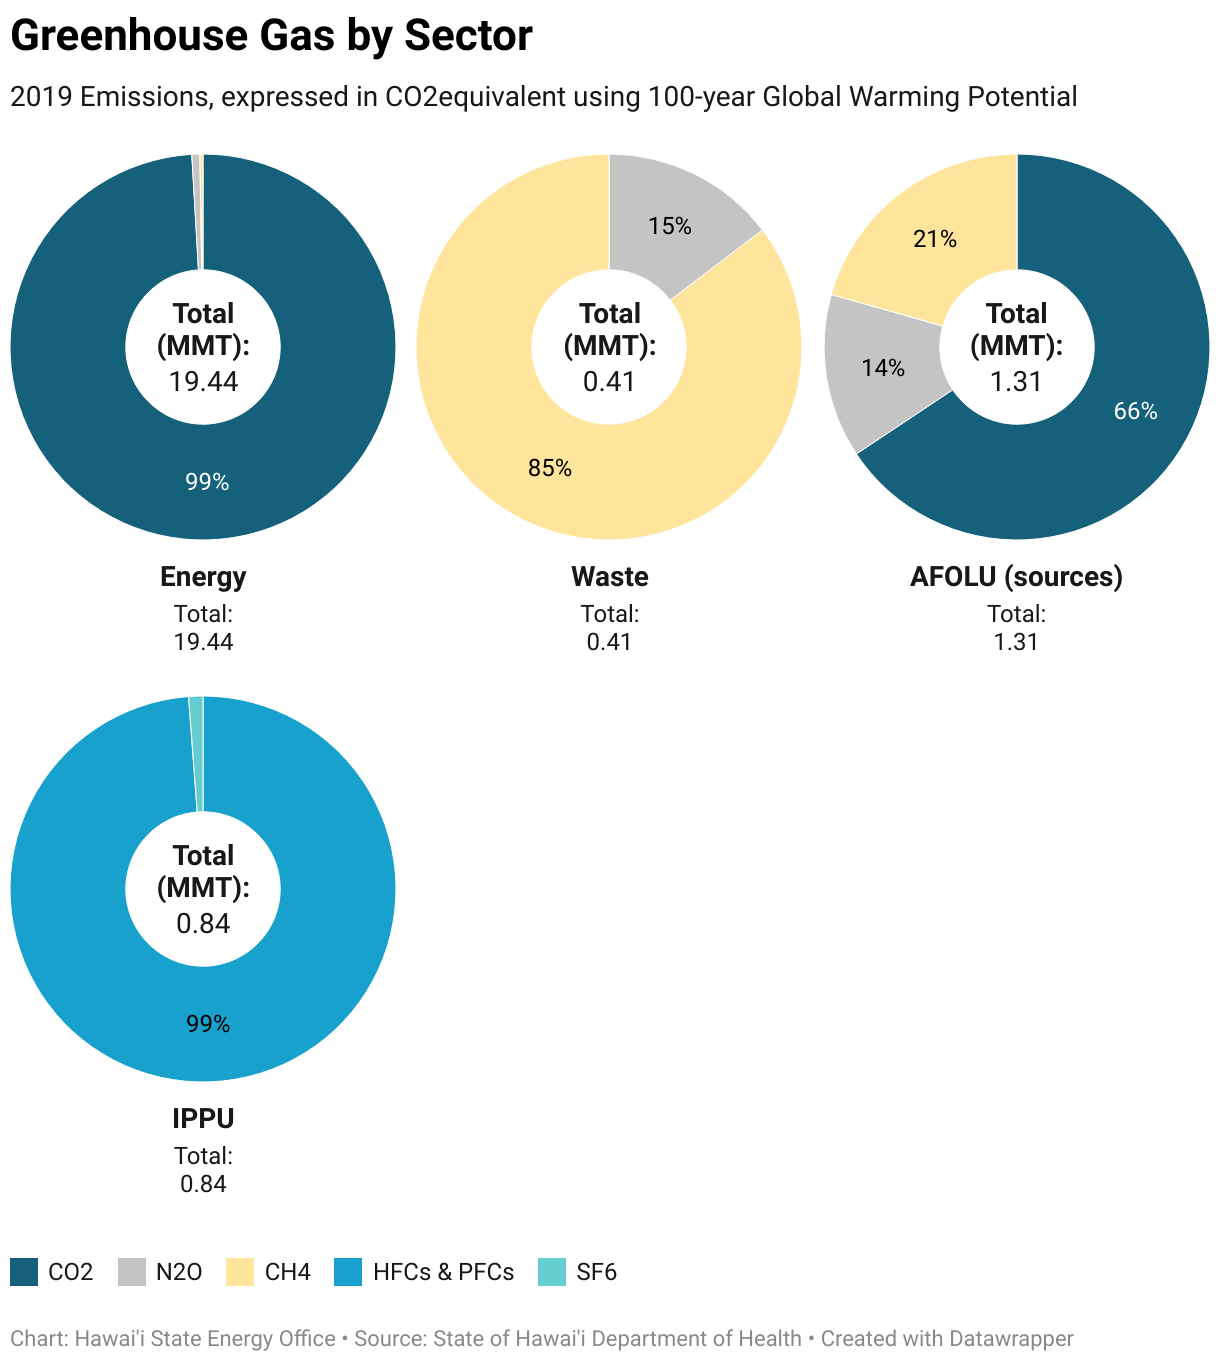
CURRENT HAWAI'I EMISSIONS
Emissions by greenhouse gas differ by sector. Emissions in the energy sector, for example, are primarily carbon dioxide (CO2). However, emissions from the waste sector are primarily methane (CH4).