
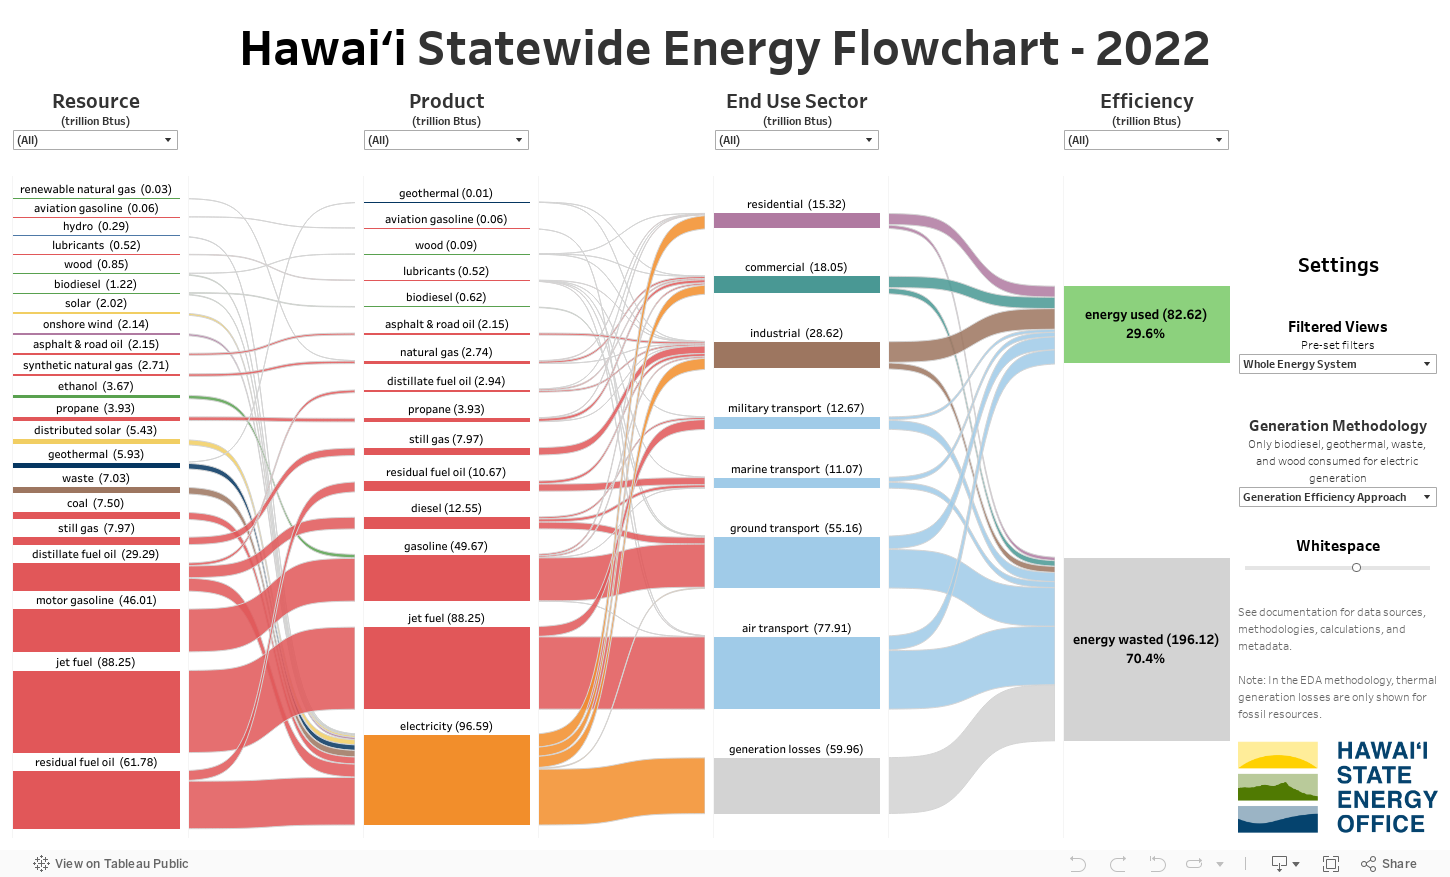
Hawaiʻi Statewide Energy FlowChart
The Hawaiʻi Statewide Energy Flowchart is an interactive data visualization that illustrates the flow of energy throughout the statewide economy. From energy resources to final consumption, see what powers our islands.
Notice: The most recent year depicted in the flowchart is 2022. Updates to the flowchart to represent 2023 are expected in spring 2025 once underlying data sources publish their finalized data.
What does the Hawaiʻi Statewide Energy Flowchart represent?
The Hawaiʻi Statewide Energy Flowchart is an interactive data visualization that represents the flow of energy throughout the statewide economy. Information is presented in the form of a flowchart and illustrates the various energy resources and products that power our islands.
Below are details and descriptions, frequently asked questions (FAQs), notices about future updates, and a downloadable PDF containing comprehensive documentation.
Note: The following sections refer to the Hawaiʻi Statewide Energy Flowchart above as “the flowchart”.
Details and Descriptions
Inspired by the Energy Flow Charts published by Lawrence Livermore National Laboratory (LLNL), the Hawaiʻi State Energy Office (HSEO) constructed an interactive data visualization to represent statewide energy flows. The flowcharts use publicly accessible data from federal and state government agencies, and when needed from private industry. Users can view how energy is used to power the statewide economy utilizing the flowchart’s various filters.
A flowchart (sometimes called “Sankey diagram”), is a method of data visualization that can depict quantities traveling from one category to another.
The Hawaiʻi Statewide Energy Flowchart illustrates the journey of energy resources to their final consumption.
Below are descriptions of the pre-set filters that illustrate common elements of the Hawaiʻi energy system. See descriptions below and use the setting on the right-hand side of the dashboard to view each pre-set filter selection.
This selection reveals economy-wide energy flows across all sectors in Hawaiʻi.
This selection illustrates the statewide electricity generation, inclusive of generation losses. See Generation Efficiency Approach (GEA) in Electricity Generation Methodologies for more information.
This selection illustrates statewide electricity deliveries to end-use sectors, not inclusive of generation losses. See Electricity Delivered Approach (EDA) in Electricity Generation Methodologies for more information.
The EDA methodology values are consistent with Renewable Portfolio Standard (RPS) values which account for renewable energy generation as a percentage of annual net electric generation. When the “Filtered Views” setting is set to “Electricity Delivered”, the proportions of energy resources on the far left of the flowchart are identical to utility-reported RPS values.
For more information regarding the Hawaiʻi RPS, visit the Hawaiʻi Public Utilities Commission’s webpage: Renewable and Energy Efficiency Policies.
This selection only includes fossil fuel energy resources.
This selection only includes renewable energy resources.
This selection only includes energy flows through air, ground, marine, and military transportation end use sectors.
This selection only includes energy flows through the ground transportation end use sector.
This selection only includes energy flows that pass through “electricity” in the product column and “ground transport” in the end use sector column.
Key internal assumption: 90% percent of the statewide EV charging load occurs within the residential sector (charging units in homes) and the remaining 10% occurs within the commercial sector (charging units available to the public). See documentation for more information.
Electricity generation is represented using two different methodologies—Electricity Delivered Approach (EDA) and Generation Efficiency Approach (GEA)—to account for the variety of ways different stakeholders represent the consumption of energy in the electric power sector. The primary difference between the methodologies is how electric generation losses are represented and calculated in the flowchart.
Thermal generation losses are incurred by fossil electricity generation resources in both methodologies. While biodiesel, geothermal, wood, and waste inherently have thermal generation losses incurred during electricity generation, these losses are only accounted for in the GEA methodology.
Electricity generation resources that are represented by only the EDA: distributed solar, hydroelectric, onshore wind, and solar.
Electricity generation resources that are represented by only the GEA: coal, distillate fuel oil, and residual fuel oil.
Electricity generation resources that are represented by both the EDA and the GEA: biodiesel, geothermal, wood, and waste. For these resources, the user must select a methodology in the setting labeled “Generation Methodology”, seen on the right-hand side of the flowchart.
Refer to the subsections below for descriptions of each methodology.
The EDA methodology assumes a 100% electric generation efficiency rate and no electric generation losses are represented. In other words, the EDA methodology shows that the total amount of energy from a resource used to generate electricity equals the total amount of energy delivered to end use sectors in the form of electricity; thermal losses are not accounted for.
Four electricity generating renewable energy resources are represented in the flowchart by only the EDA methodology: distributed solar, hydroelectric (hydro), onshore wind, and solar (utility-scale).
Electric generation from fossil energy resources (coal, distillate fuel oil (DFO), and residual fuel oil (RFO)) is not estimated using the EDA methodology. Since a fossil fuel’s energy conversion process involves thermal generation losses and plant-specific annual average heat rates published in the EPA’s eGRID database are accessible, electric generation from fossil fuel resources is represented only using the GEA.
However, the remaining electricity-generating energy resources (the renewable resources of biodiesel, geothermal, waste, and wood) are estimated using both the EDA and the GEA methodologies. Notably, their energy conversion processes include thermal generation losses, which are not appropriately represented in the EDA methodology.
See documentation for more details.
The GEA methodology accounts for energy loss during the production of electricity. When an energy resource is consumed to generate electricity, a portion of the energy consumed is converted into electricity, and delivered to end use sectors, and the remainder of the energy is lost in the energy conversion process, usually as heat. The GEA methodology represents thermal generation losses as part of the electric generation process using the published annual generation efficiency rates.
Electric generation from fossil energy resources (coal, distillate fuel oil (DFO), and residual fuel oil (RFO)) are estimated using only the GEA methodology since their energy conversion process involves thermal generation losses. To estimate the generation losses from thermal generation resources, the facility-specific heat rates published in the EPA’s eGRID database were applied to the energy content of the fuel consumed.
Four electricity-generating renewable energy resources are not estimated using the GEA methodology: distributed solar, utility-scale solar, hydroelectric, and onshore wind.
However, the remainder of the electricity-generating energy resources (the renewable resources of biodiesel, geothermal, waste, and wood) are estimated using both the EDA and GEA methodologies since their energy conversion process includes thermal generation losses. To estimate electric generation losses from biodiesel, waste, and wood, the facility-specific heat rates published in the EPA’s eGRID database were applied to net generation levels published in the RPS reports submitted to the Hawaiʻi Public Utilities Commission (PUC) from both Hawaiian Electric Company (HECO) and Kauai Island Utility Cooperative (KIUC). To estimate electric generation losses from geothermal, a global average generation efficiency rate was applied to the net generation level published in HECO’s RPS report submitted to the PUC.
See the documentation for more details.
The flowchart consists of four levels, appearing as the four columns seen in the flowchart: resource, product, end use sector, and efficiency.
At each of these levels, energy flows are directed into categories.
For detailed descriptions of each resource, product, end use sector, and efficiency status, refer to the documentation included at the end of the webpage.
The first column of the flowchart represents the originating energy resource, which comprise the products consumed by each end use sector. For example, when gasoline is the product consumed by an end use sector, the two energy resources that comprise gasoline—motor gasoline and ethanol—are shown in the first column.
See documentation for detailed descriptions of each resource.
Products refer to what is consumed by end use sectors for energy-related activities.
Any duplicative categories in the first and second columns of the flowchart representing resources and products are reflective of energy resources that are both directly consumed by end use sectors while also comprising other products consumed by end use sectors.
See documentation for detailed descriptions of each product.
The third column of the flowchart represents the end use sectors that consume given energy products. The seven end use sectors that electricity and fuel consumption occur in are listed as follows: commercial, industrial, residential, and the four transportation sectors (air, ground, marine, and military).
However, when viewing the end use sector flowchart column, an eighth category appears—generation losses. While generation losses appear to be represented as an end use sector in the Sankey chart, it is not. The flowchart category “generation losses” is a visual representation the energy lost in the electricity generation process.
See documentation for detailed descriptions of each end use sector.
Inspired by the Energy Flow Charts published by Lawrence Livermore National Laboratory (LLNL), the last column in the flowchart is an estimation of energy used to perform intended tasks (i.e., useful mechanical work). This distinction indicates the level of energy waste in the entire energy system and represents an estimation for the total efficiency of the energy system.
See documentation for detailed descriptions of each efficiency status.
The construction of the flowchart was made possible from primarily the five organizations listed below. More data sources that were used are noted throughout the documentation to accommodate smaller edge cases.
See documentation for more information.
Three EIA data sources were used for the construction of the flowchart:
- State Energy Data System (SEDS)
- Aggregates current and historical energy statistics on an annual basis
- Primary data source that underlies LLNL’s Energy Flow Charts that the Hawaiʻi Statewide Energy Flowchart is inspired from
- Refer to the data source here
- Form EIA-821 Annual Fuel Oil and Kerosene Sales Report
- Distributes distillate fuel oil (DFO) consumption across end use sectors
- Refer to the data source here
- Form EIA-923 Power Plant Operations Report
- Collects and aggregates electric power data on various categories such as electricity generation, fuel consumption, and fossil fuel stocks
- Refer to the data source here
The Emissions & Generation Resource Integrated Database (eGRID) is used to estimate thermal generation losses for electric generation. For each electricity-producing resource, a efficiency percentage was derived from eGRID’s reported plant nominal heat rates (weighted on facility generation levels).
Refer to the data source here.
The Highway Statistics Series is an annual publication of highway transportation statistics that derive mostly from state-reported information. Two tables in the Highways Statistics Series were used distribute gasoline and ethanol consumption across the four transportation end use sectors:
Two PUC data sources were used for the construction of the flowchart:
- Docket No. 2007-0008, Renewable Portfolio Standard (RPS) Annual Reports
- Collects statutory RPS reports from the two electric utility providers in Hawaiʻi—Hawaiian Electric Company (HECO) and Kauai Island Utility Cooperative (KIUC)
- The flowchart’s electric generation values from renewable energy resources derive from net generation values reported in HECO’s and KIUC’s RPS reports
- Refer to data source here
- HRS 269-45 Gas Utility Companies Renewable Energy Report
- Collects statutory renewable energy reports from the sole gas utility provider in Hawaiʻi—The Gas Company (i.e., Hawaiʻi Gas)
- Used to estimate renewable natural gas (RNG) and synthetic natural gas (SNG) production in Hawaiʻi
- Refer to data source here
The estimation of electricity consumption by the ground transportation end use sector—assumed to represent electric vehicles (EVs)—is derived from the PATHWAYS model that estimated the future electric load attributed to EVs.
For more information about the PATHWAYS model its use in HSEO’s 2023 Decarbonization Report, refer here.
Frequently Asked Questions (FAQ’s)
Below are some of the most frequently asked questions regarding the flowchart.
Energy used and energy wasted are the two categories in the fourth column of the flowchart which depict energy efficiency. Energy used largely represents useful mechanical work and energy wasted largely represents the energy consumed for the production of such work.
The more energy efficient an energy system is, the more useful work is generated by that energy system. Thus, the larger the energy used category will be relative to energy wasted.
Conversely, the less energy efficient an energy system is, the less useful work is generated by that energy system. As a result, the larger the energy wasted category will be relative to energy used.
The flowchart is representative of energy flows within the geographical boundaries of Hawaiʻi. Any energy flows that do not enter Hawaiʻi are not represented in the flowchart.
The only edge cases that are represented in the flow chart are air and marine transportation that originate in Hawaiʻi and travel to a destination beyond the state’s geographic boarders.
For example, a container ship or a commercial jet liner that departs Hawaiʻi for the continental United States is represented within the flowchart. However, the arrival of the same ship and airplane returning from the continental United States back into Hawaiʻi is not represented in the flowchart.
The primary data source for the flowchart is the State Energy Data System (SEDS) which is managed by the United States Energy Information Administration (EIA). Upon the February 2025 publication date, the most recent finalized data provided by SEDS is reflective of 2022. While there is SEDS data available on the EIA’s Open Data Browser for 2023, it has not yet been finalized by EIA. Once SEDS data for 2023 is published (expected in March-April 2025), the flowchart will be updated to reflect 2023.
No. The transfer of electricity from the location of generation to end use sectors is assumed to be 100% efficient. No transmission losses (i.e., line losses) are represented in the flowchart. Hawaiʻi has an average transmission and distribution loss of 5.4%.
No. The flowchart does not represent any kind of greenhouse gas (GHG) emissions.
All information represented in the flowchart originate from published reports by federal and state government agencies in addition to data provided by the private sector.
No predictive forecasting methods were used to derive the values seen in the flowchart.
The “solar” energy resource refers to utility-scale solar resources (e.g., commercial solar farms) while the “distributed solar” energy resource refers to residential rooftop solar.
The primary difference between DFO and RFO is the amount of refining done to the product.
DFO is a light fuel oil that is more refined than RFO. The primary products that DFO comprise are:
- Diesel fuels (No. 1, No. 2, and No. 4) used for trucks, automobiles, and agricultural equipment
- Fuel oils (No. 1, No. 2, and No. 4) used for space heating and electric power generation
RFO is a heavy fuel oil that is what remains after DFOs and lighter hydrocarbons are removed in the refining process. The primary products that RFOs comprise are:
- No. 5 fuel oils used for military purposes and electric power generation
- No. 6 fuel oils used for electric power generation, vessel bunkering, and various industrial purposes
In 2022, only SNG and RNG comprised the natural gas distributed to and consumed by end use sectors. Liquified natural gas (LNG) was not imported into Hawaiʻi in 2022 and was assumed to not be part of the statewide natural gas mix.
Locally produced SNG is derived from the petroleum refining byproduct naphtha, while locally produced RNG is sourced from harnessed biogas from wastewater treatment.
See documentation for a detailed description for how these assumptions were made and the underlying data sources.
Yes. To view the RPS, select the Filtered View for “Electricity Delivered (RPS)”.
However, to view a more nuanced depiction of electricity generation, select the filtered view “Electricity Generation”. This selection enables the flowchart to represent the electric generation efficiency of each electricity-producing resource.
Yes. The color scheme of the flowchart is intended to group similar energy flows.
The important color associations to note are as follows (if not described below, color selection was unique to its own):
- Resources (first column)
- Red: Majority fossil fuel-derived energy resource (e.g., coal, gasoline, jet fuel, natural gas, residual fuel oil, etc.)
- Green: Energy resources deriving from biomass
- Yellow: Solar energy resources
- End Use Sector (third column)
- Light Blue: All end use sectors pertaining to transportation
The sole electric generation plant in Hawaiʻi ceased operations in September 2022. Since the most current year depicted in the flowchart is 2022, coal appears as an electricity generating resource. When the flowchart is updated to reflect 2023, coal will no longer appear as an electricity generating resource.
Generation losses (i.e., the energy lost mostly as heat in the process of converting an energy resource to electricity) are automatically considered wasted energy. In the energy flowcharts published by Lawrence Livermore National Laboratory (LLNL), the identical energy flow passes directly from the “electricity generation” node to the “rejected energy” node (seen in our flowchart as from the “electricity” node to the “energy wasted” node). This energy flow representing electric generation efficiency losses needs a category to pass through in the third column of the flowchart, thus seen as “generation losses”.
Methodologies, Assumptions, and Data Sources
Comprehensive documentation of the flowchart’s underlying methodologies, assumptions, and data sources will be available as a PDF on Monday, February 10, 2025.
Future Updates
Upon initial publication of the Hawaiʻi Statewide Energy Flowchart in February 2025, the data reflected is representative of 2022.
The primary data source that comprises the visual representation of the flowchart is the State Energy Data System (SEDS) which is managed by the United States Energy Information Administration (EIA). Upon the February 2025 publication date, the most recent finalized data provided by SEDS is reflective of 2022. While there is SEDS data available on the EIA’s Open Data Browser that is reflective of 2023, the 2023 data cannot be accessed using EIA’s API since the 2023 data is not yet finalized.
Once SEDS data for 2023 is finalized (expected in March-April 2025), the flowchart will be updated.
This distinction between 2022 and 2023 as being the most recently available data is notable since the sole coal-fired electric generation plant ceased operations in September 2022.
The Hawaiʻi Statewide Energy Flowchart is in direct alignment with the directives and statutory requirements spelled out in HRS §196-72, which stipulates that HSEO’s Chief Energy Officer shall:
“Identify, track, and report key performance measures and milestones related to the State’s energy and decarbonization goals“
and
“Develop and maintain a comprehensive and systematic quantitative and qualitative capacity to analyze the status of energy resources, systems, and markets, both in-state and in other states and countries…“
and
“Act as the State’s energy data clearinghouse by identifying, collecting, compiling, analyzing, publishing, and where possible, monetizing energy and clean transportation data and analyses”